Overview
Storyline is an efficient way to provide users with a quick temporal understanding of a scenario and to simplify the interpretation of content in OpenDRIVE files through a two-dimensional image. The Safety Pool™ database introduces this feature to help communicate and compare scenarios and manoeuvre details for end users.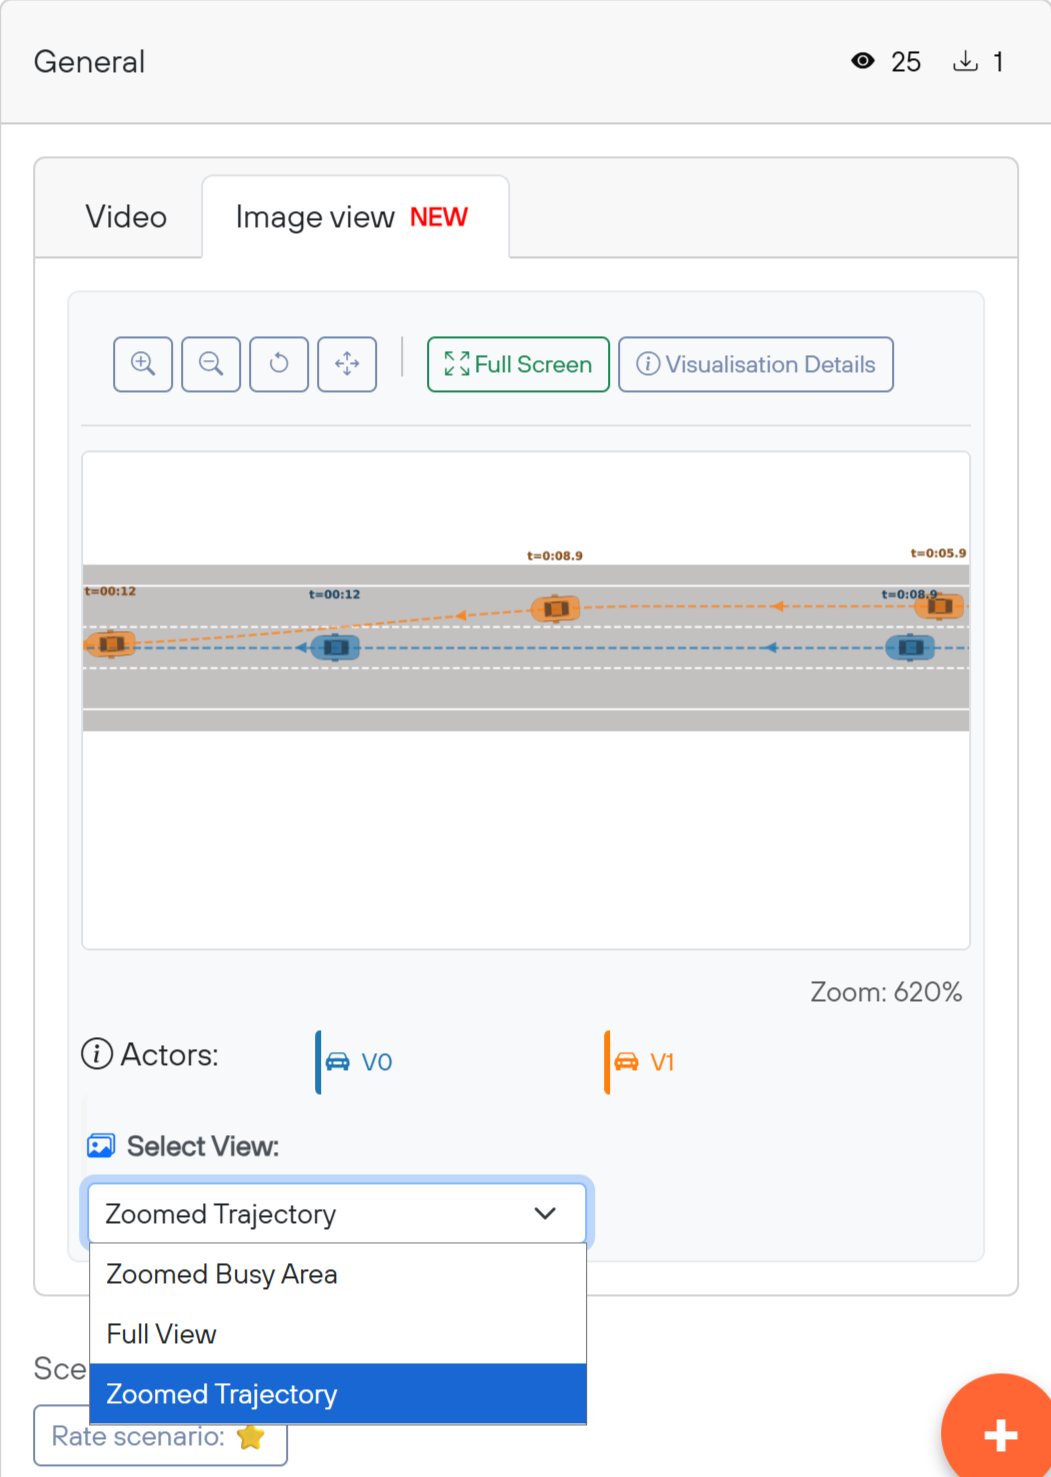
For each active scenario that includes OpenSCENARIO and OpenDRIVE files, an image is generated and displayed in the Image View tab.
Image View
In the Image View tab (located in the General sidebar panel), users can browse the image and switch between different visualization types:
Zoomed Busy Area : Focuses on the busiest part of the road, highlighting areas with the highest actor overlaps.
Zoomed Trajectory: Displays a top-down view of all trajectories while excluding stationary actors.
Full view: Illustrates the entire road network along with all actors, including stationary ones.
Annotations
The trajectory of each actor is represented by a series of ghost (shadow) figures along the road. Each ghost is accompanied by a time label (colour coded) that indicates the actor’s exact position at a specific moment in time.
.png)
For example, the image below illustrates a cut-in scenario occurring at t = 00.12 s, where the orange car (V1) cuts in front of the blue car (V0), after which both vehicles continue driving forward.
Additional Controls:
The “Full screen” button provides an expanded view, making it easier to analyse complex scenarios.
.png)
The “Visualization Details” button opens the Visualization Details tab (a new tab added next to Definition).
.png)
In the Visualization tab, manoeuvre details are listed in a temporal format. Each row represents a time frame and shows the corresponding actions and speeds of each actor.
The blue paragraph beneath the timeline table describes the time interval between each ghost (shadow). This allows users to compare the speed of different actors by evaluating the distance travelled within the same timestamp. The time interval is automatically adjusted based on the overall duration of the scenario. To keep the visualization clear and uncluttered, the number of ghost figures displayed is limited.